This quick tutorial will show you how to calculate the chi square (test of independence) statistic in SPSS and also how to interpret the result of the calculation.
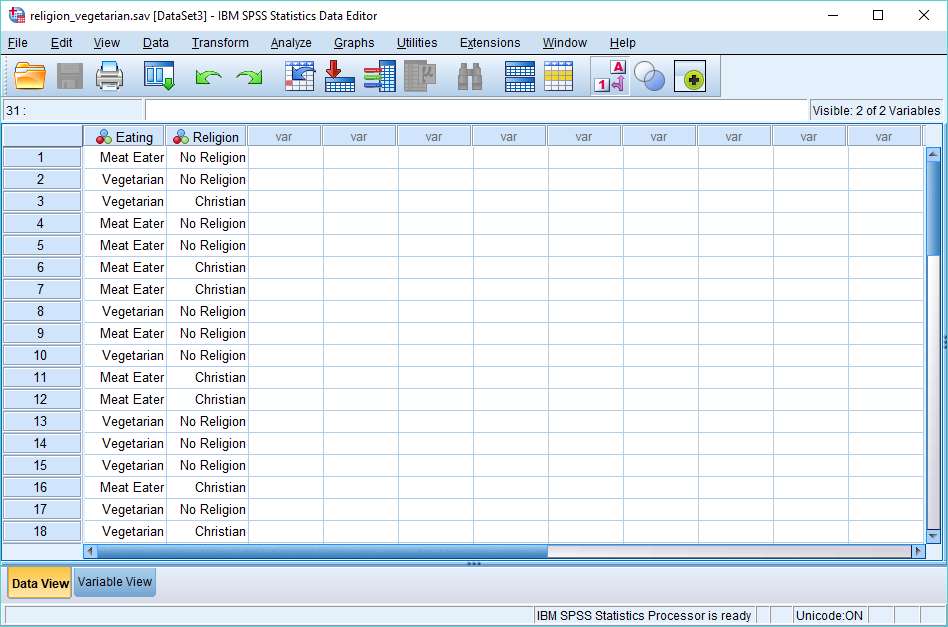
As usual with these quick tutorials, we’re starting from the assumption that you have already imported your data into SPSS, and you’re looking at a Data View screen that looks something like this (though with different categorical values, and perhaps additional columns).

We want to find out whether the two categorical variables (in this case, Eating and Religion) are associated with each other – that is, are they dependent or independent? The chi square test is appropriate for this task.
To begin the calculation, click on Analyze -> Descriptive Statistics -> Crosstabs. This will cause the crosstabs dialog to appear.
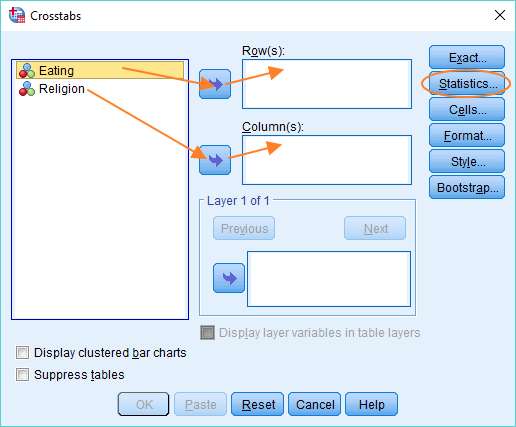
You’ll see your variables on the left. In our example, it’s two variables, but if you have more than two, you’ll need to identify the two you want to test for independence.
You need to get one of these variables into the Row box, and the other into the Column box. It doesn’t matter which variable goes into which box. You can drag and drop, or use the arrows, as above. Once you’ve got your variables into their correct boxes, you can set up the chi square test by hitting the Statistics button, and selecting the Chi-square option in the dialog that appears.
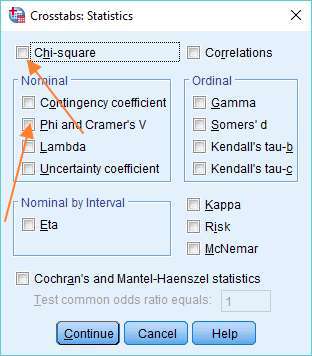
If you also want a measure of effect size, select Phi and Cramer’s V in the same dialog box, and then press Continue, otherwise just press Continue.
The next stage is not required, but it is recommended. Click on the Cells button in the Crosstabs dialog box.
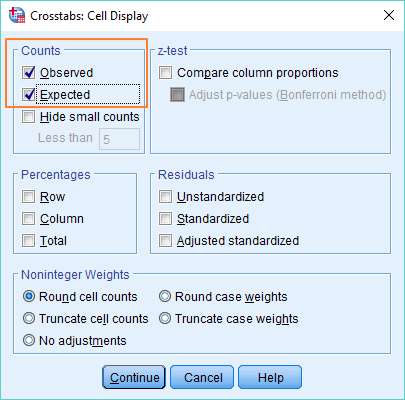
Then under Counts, select Observed and Expected (which will give you observed and expected values when you run the chi square test). Click Continue to exit the dialog.
Press OK to generate the chi square statistic and crosstabs table.
Note: We have a tutorial that deals in more detail with interpreting a chi square test result.
The results page looks a little complex, but actually isn’t as baffling as it might at first seem.
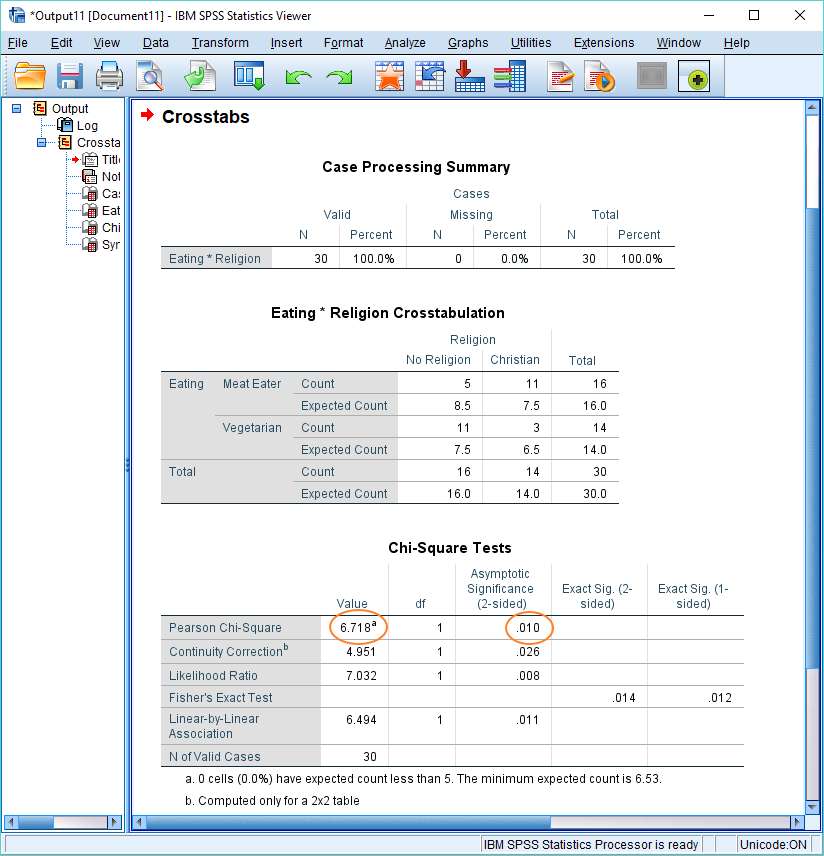
The chi square statistic appears in the Value column of the Chi-Square Tests table immediately to the right of “Pearson Chi-Square”. In this example, the value of the chi square statistic is 6.718. The p-value appears in the same row in the “Asymptotic Significance (2-sided)” column (.010). The result is significant if this value is equal to or less than the designated alpha level (normally .05).
In this case, the p-value is smaller than the standard alpha value, so we’d reject the null hypothesis that asserts the two variables are independent of each other. To put it simply, the result is significant – the data suggests that the variables Religion and Eating are associated with each other.
If you take a look at the crosstabs table (“Eating*Religion Crosstabulation”), you can easily see that the chi square test result is consistent with the data. There are more Christian meat eaters than would be expected were the null hypothesis (that the variables are independent) true; and fewer Christian vegetarians. And similarly, there are more atheist vegetarians than would be expected, and fewer atheist meat eaters.
That’s it for this quick tutorial. You should now be able to calculate the chi square (test of independence) statistic in SPSS, and interpret the result that appears the SPSS output viewer. You might also be interested in our tutorials on (1) exporting your SPSS output to another application such as Word, Excel, or PDF and (2) reporting Chi Square results from SPSS in APA format
Our video tutorial uses a different data, and includes a slightly more detailed discussion of the logic of the test and the result. Check it out!